What is a CI?
Using a Statistic to estimate a Parameter
It is NOT a probability
It is an interval that will cover the true parameter X% of the time
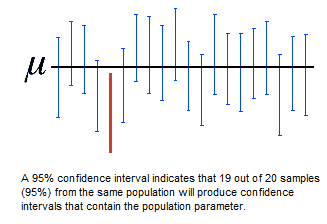
So we can interpret a CI as
- "We are X% confident that the true population parameter lies within A and B"
General Math Behind a CI
Formula
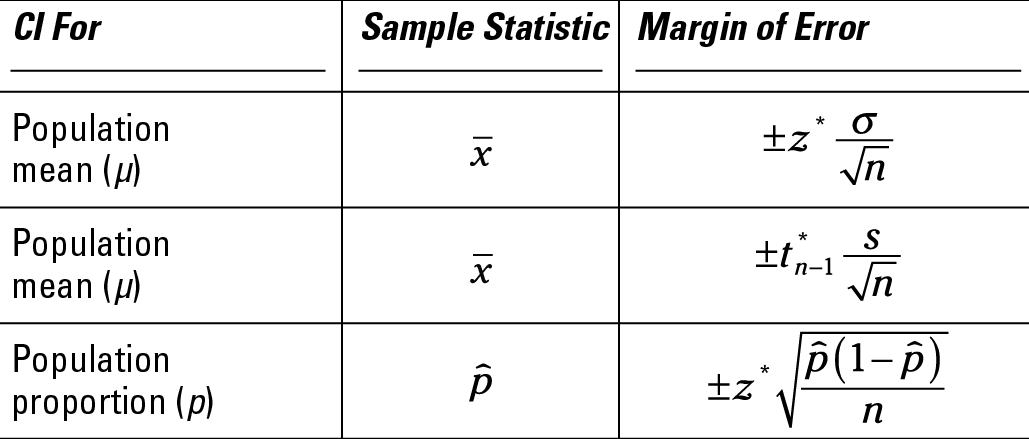
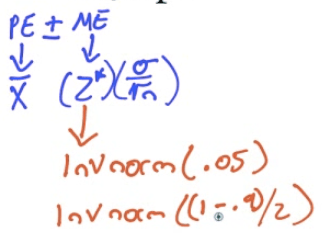
Point Estimate ± Margin of Error
Point Estimate ± Critical Value * Standard Error
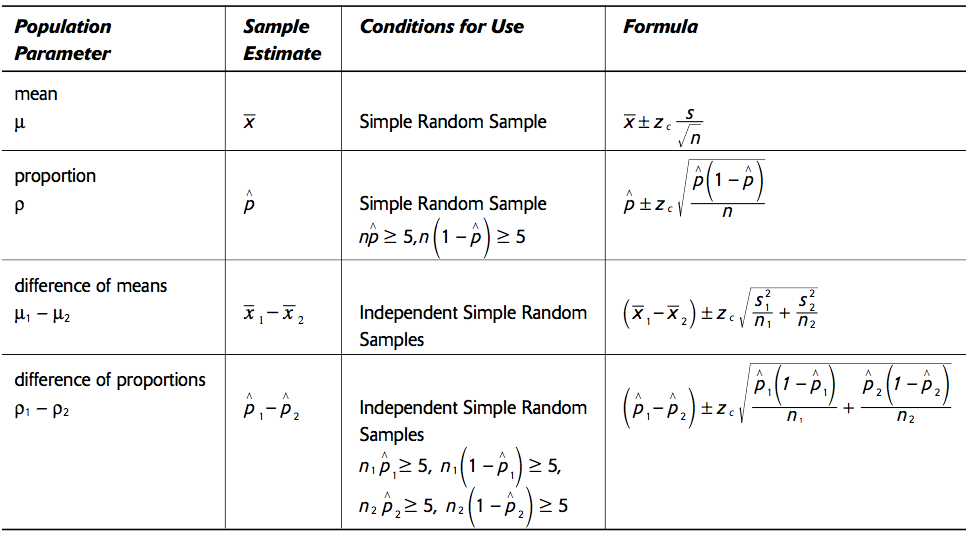
Point Estimate

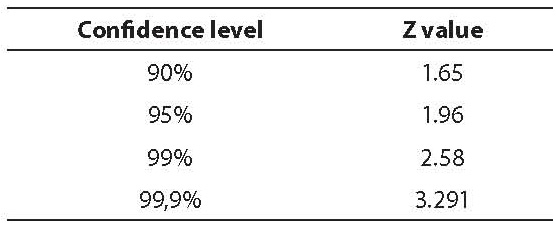
Critical Value
Standard Error
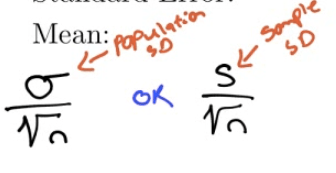
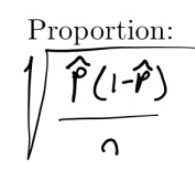
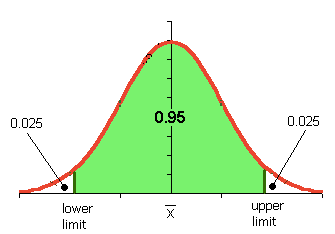
Confidence Interval
Steps to Calculating a CI
Read the problem and outline the STASTICS
Check your CONDITIONS
Random
Independent: N≥10n
Normal: n>30
CALCULATE
- Point Estimate ± Critical Value * Standard Error
INTERPRET
Some Can Calculate Intervals
Practice Questions
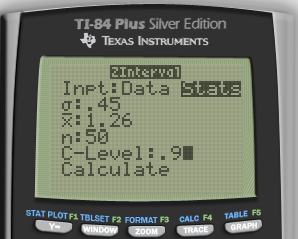
The effect of drugs and alcohol on the nervous system have been the subject of considerable research. Suppose a neurologist is testing the effect of a drug on response time by injecting 50 rats with a dose, subjecting each to a stimulus, and recording the response time. The average response time for the 50 injected rats was 1.26s. Assuming the mean response time for a rat that has not been injected with the drug is 1.4s with standard deviation of 0.45, construct a 90% confidence interval to determine if the drug has an effect on response time.
Statistics
Mean = 1.26
Population SD = 0.45
n = 50
CL = 90%
Conditions
Random: Assume rats are a random sample
Independent: N > 10n
Normal: n > 50
Calculate
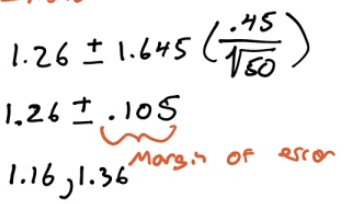
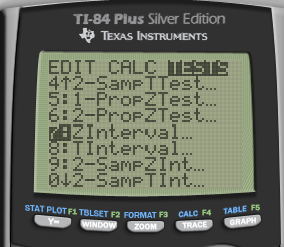
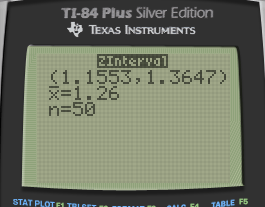
- Calculate by calculator
- Calculated using Z test
Interpret
We are 90% confident that the true mean response time for rats given the new drug is between 1.16s and 1.36s.
1.4s is not in the interval, so we have evidence the new drug make rats faster
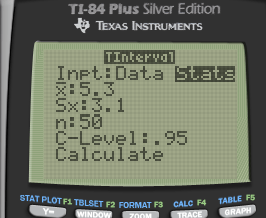
There are two fire stations in a town, one in the northern half and one the southern half. The one in the northern part is known to respond to calls within 4 min. The council members in the town are worried that the southern fire station isn’t as good so they hire a statistician. The statistician collects a random sample of 50 call/responses from the southern fire station. The mean response time is 5.3 min with a standard deviation of 3.1. Construct a 95% confidence interval to determine if the council members have cause to worry about the southern station
Statistics
Mean = 3.5
Sample SD = 3.1
n = 50
CL = 95%
Conditions
Random: Yes
Independent: N > 10n = 500
Normal: n > 30
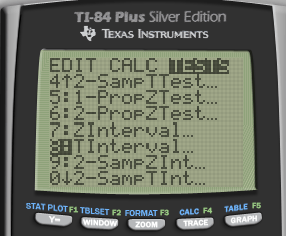
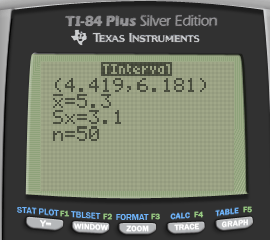
Calculate

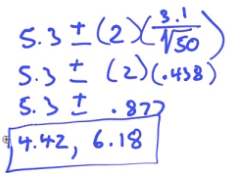
- Calculate by calculator
Interoperate
We are 95% confident that the true population mean response time for the southern fire station is between 4.42 and 6.18 mins
4 is not in the interval, so we do have reason to be concerned.
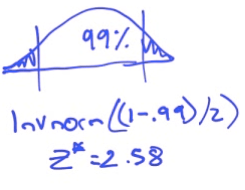
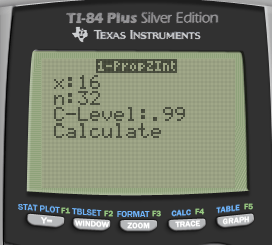
The US Department of Transportation reported that 75% of all fatally injured automobile drivers were intoxicated. A random sample of 32 records in Carson County, Colorado, showed that 16 involved a drunk driver. Use a 99% confidence interval to determine whether or not there is evidence that indicates the population proportion of driver fatalities related to alcohol is different than 75%
Statistics
P hat = x / n = 16/32 = 0.5
n = 32
CL = 99%
Conditions
Random: Yes
Independent: N > 10n = 320
Normal: n * p hat > 10 and n * (1-p hat) >10
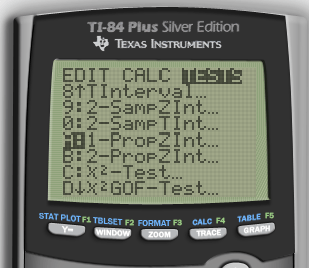
Calculate

- Calculate by calculator
Interperate
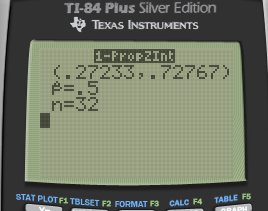
We are 99% confident that the true population proportion of driver fatalties in Carson County is between 27.2% and 72.8%
75% is not in our interval, so it appears that Carson County is lower in the US